Alle integrasjoner

Analytics for Todoist

Get a comprehensive look at your Todoist task activity.

Finn ut mer

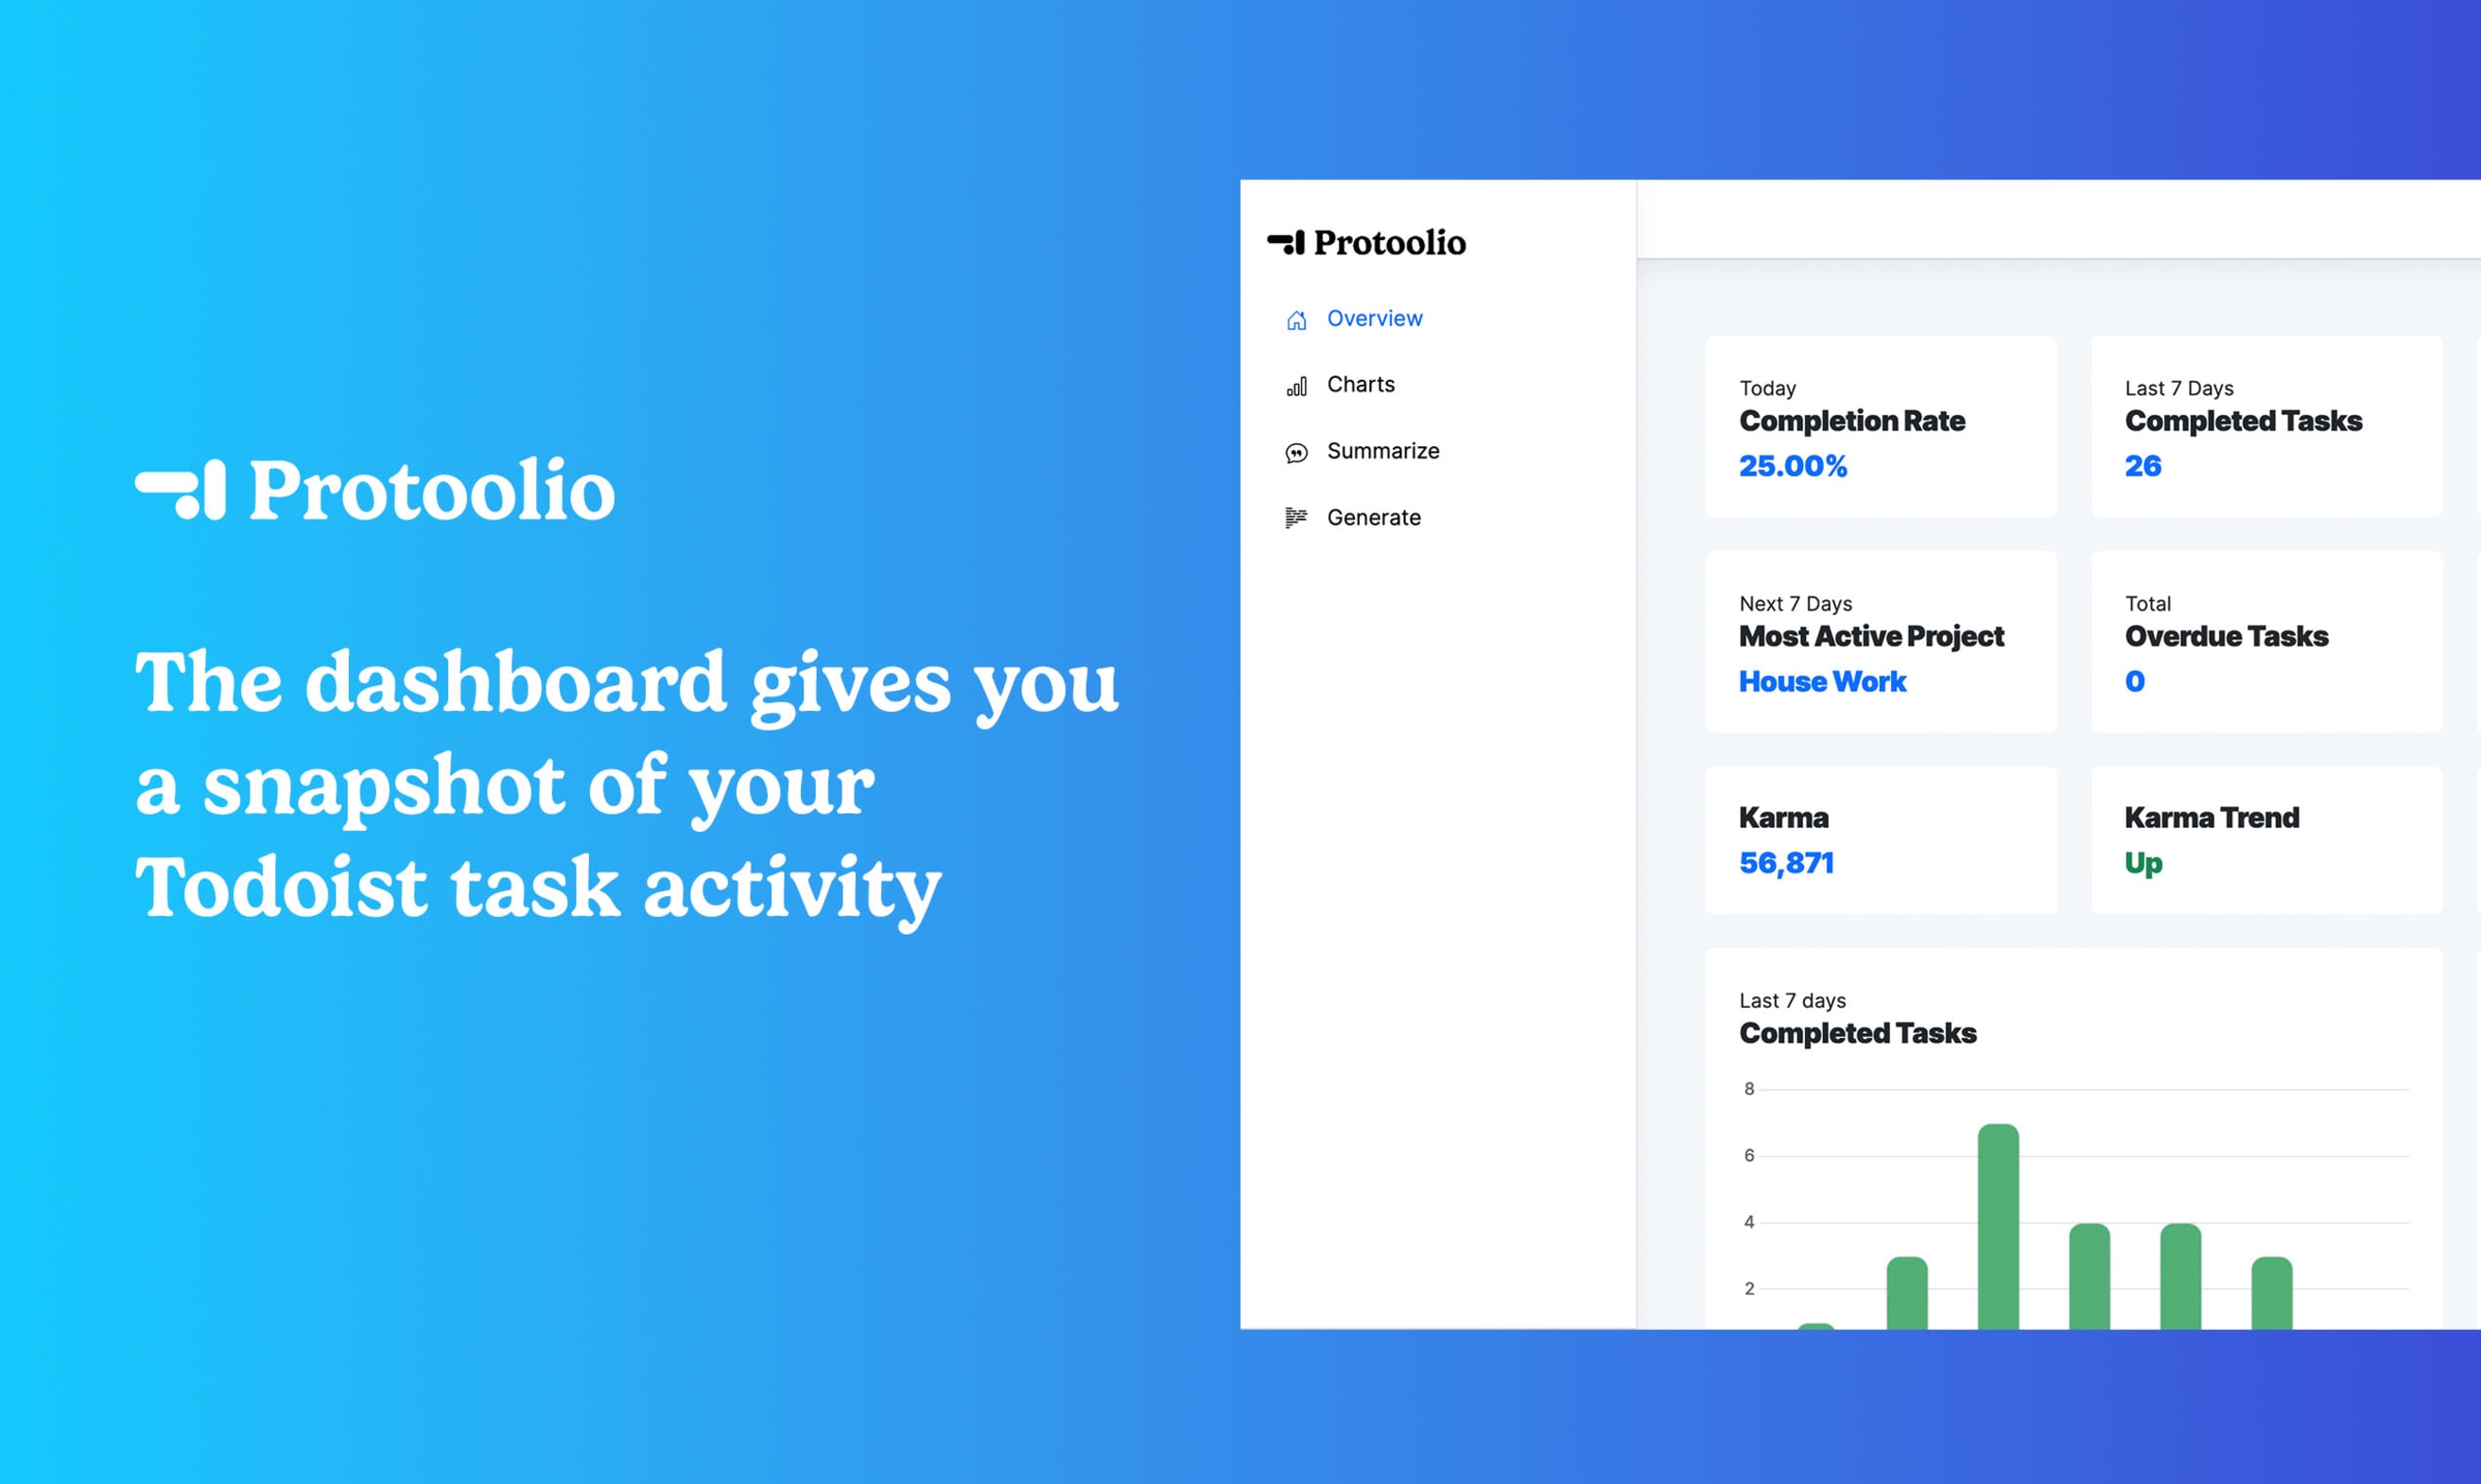
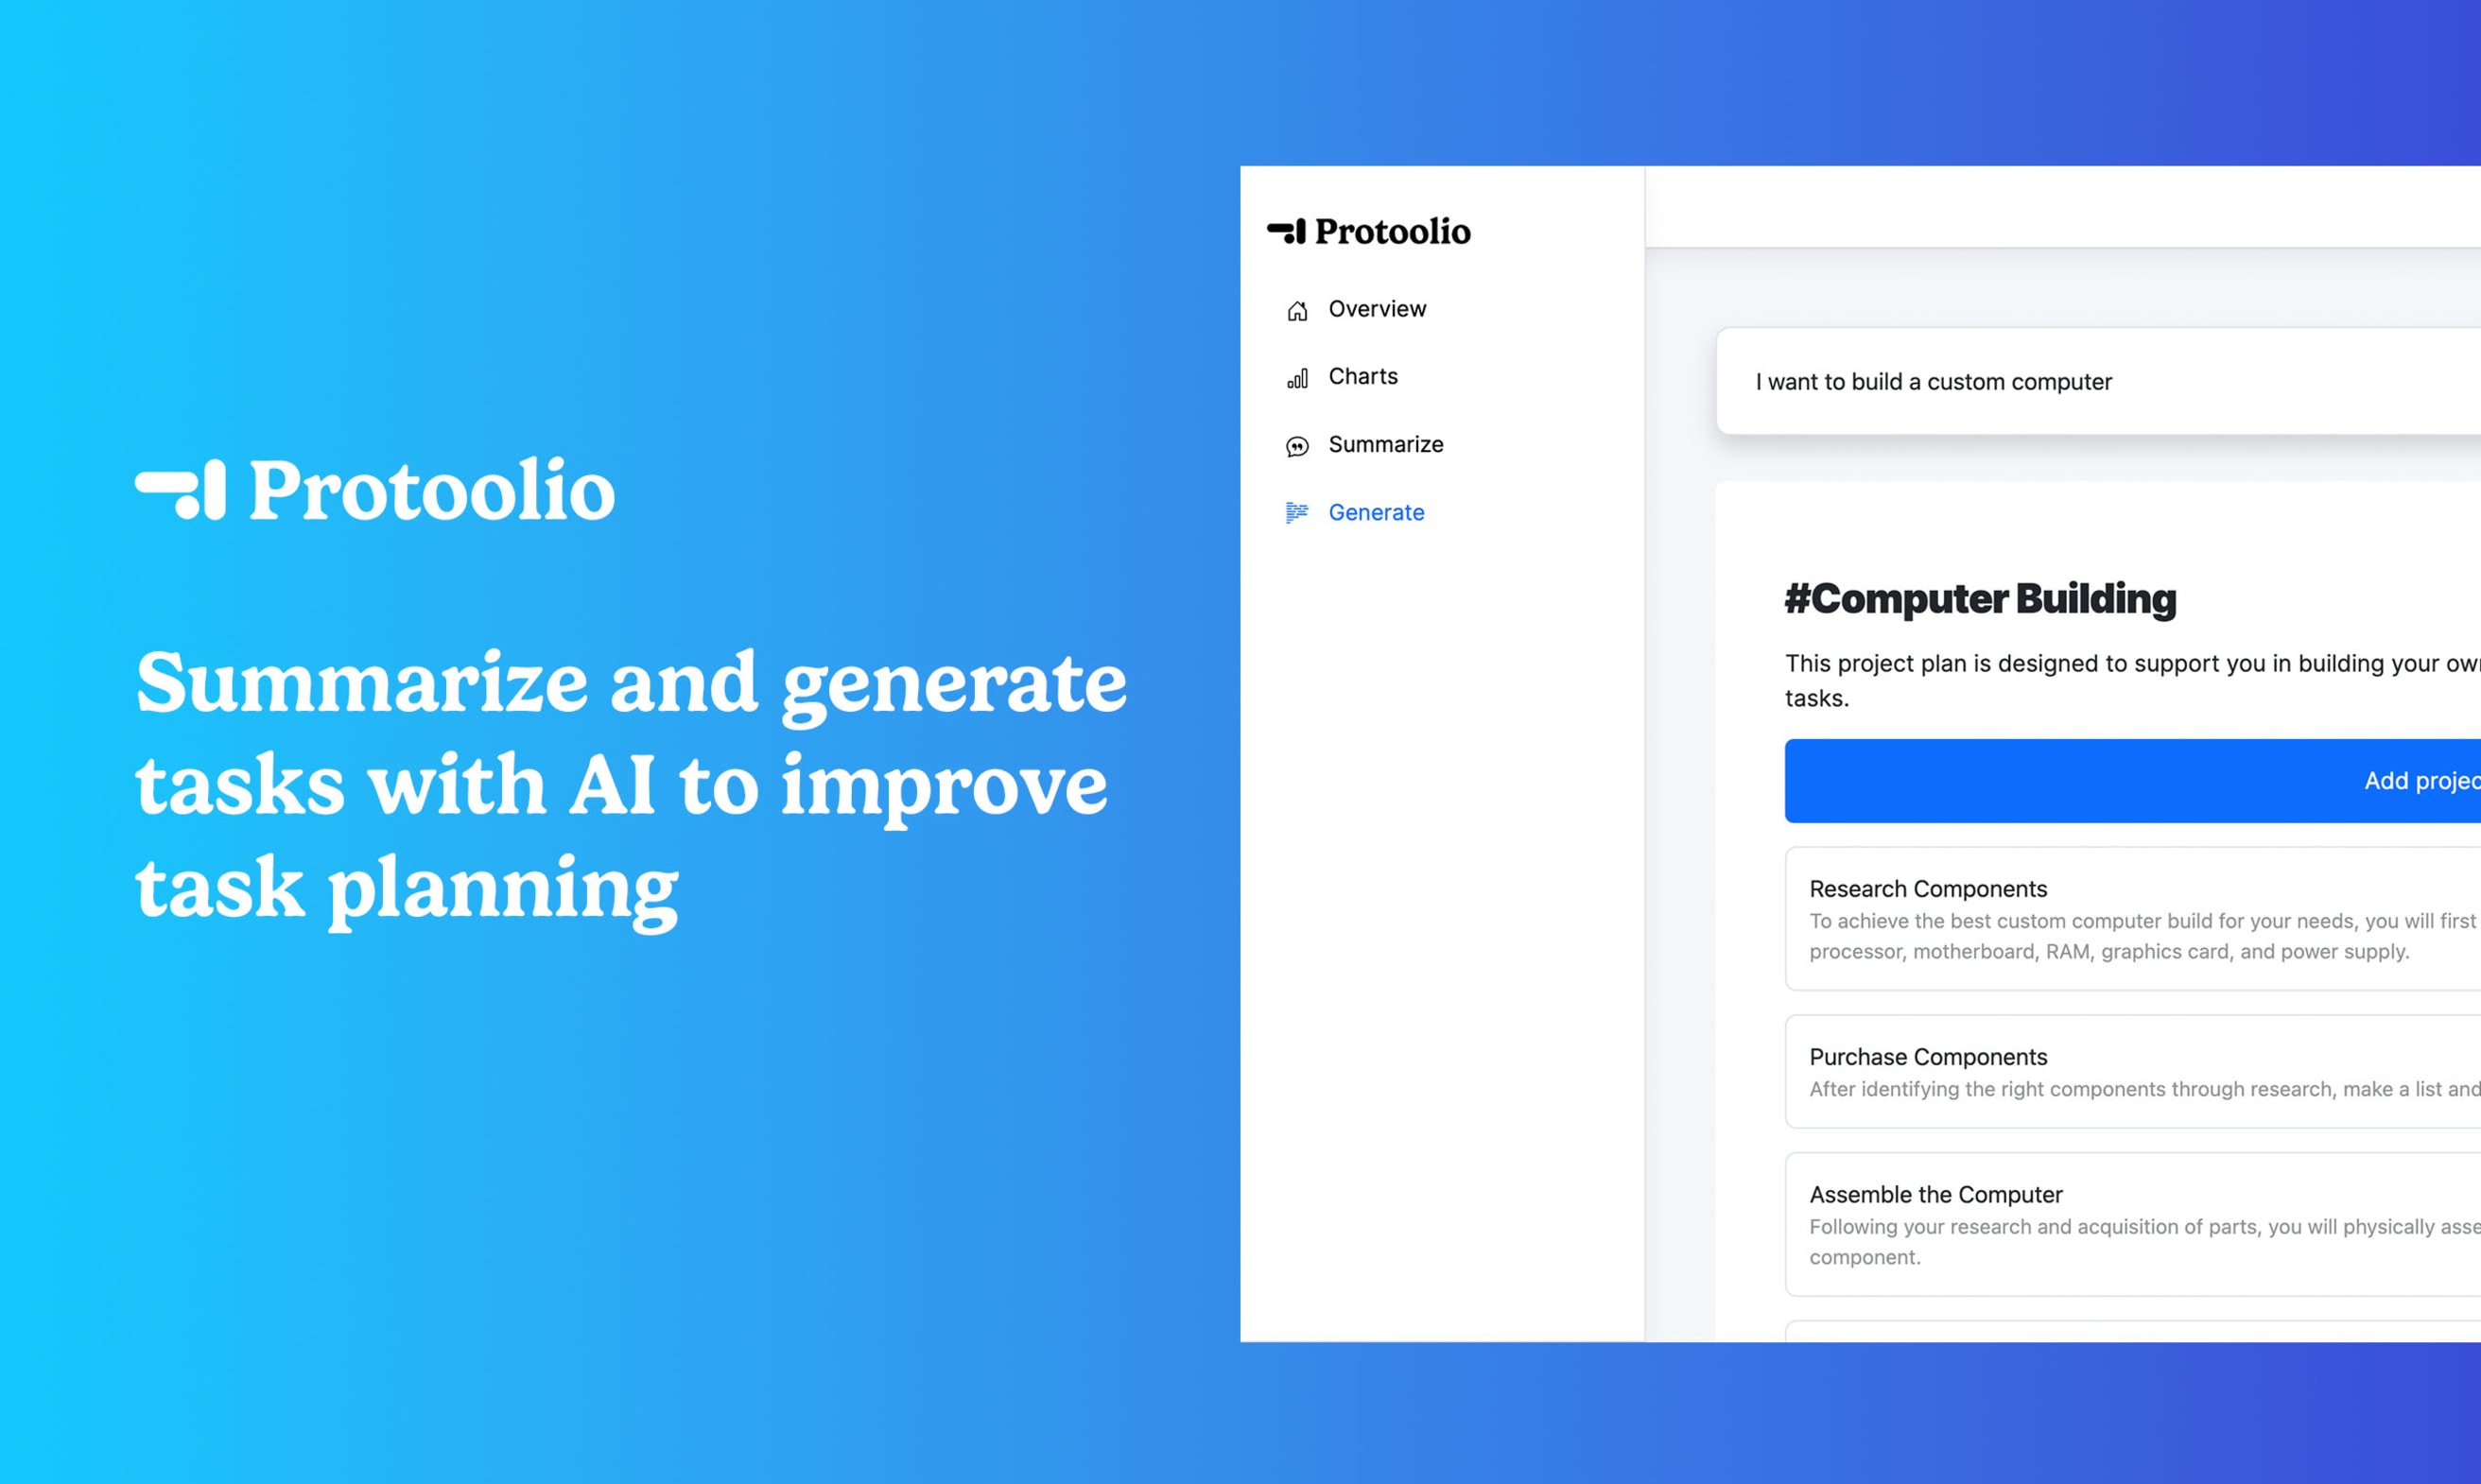
Boost your productivity with data insights! Get a full view of your Todoist tasks and track productivity trends. The Analytics for Todoist dashboard offers a quick overview of your task activity.

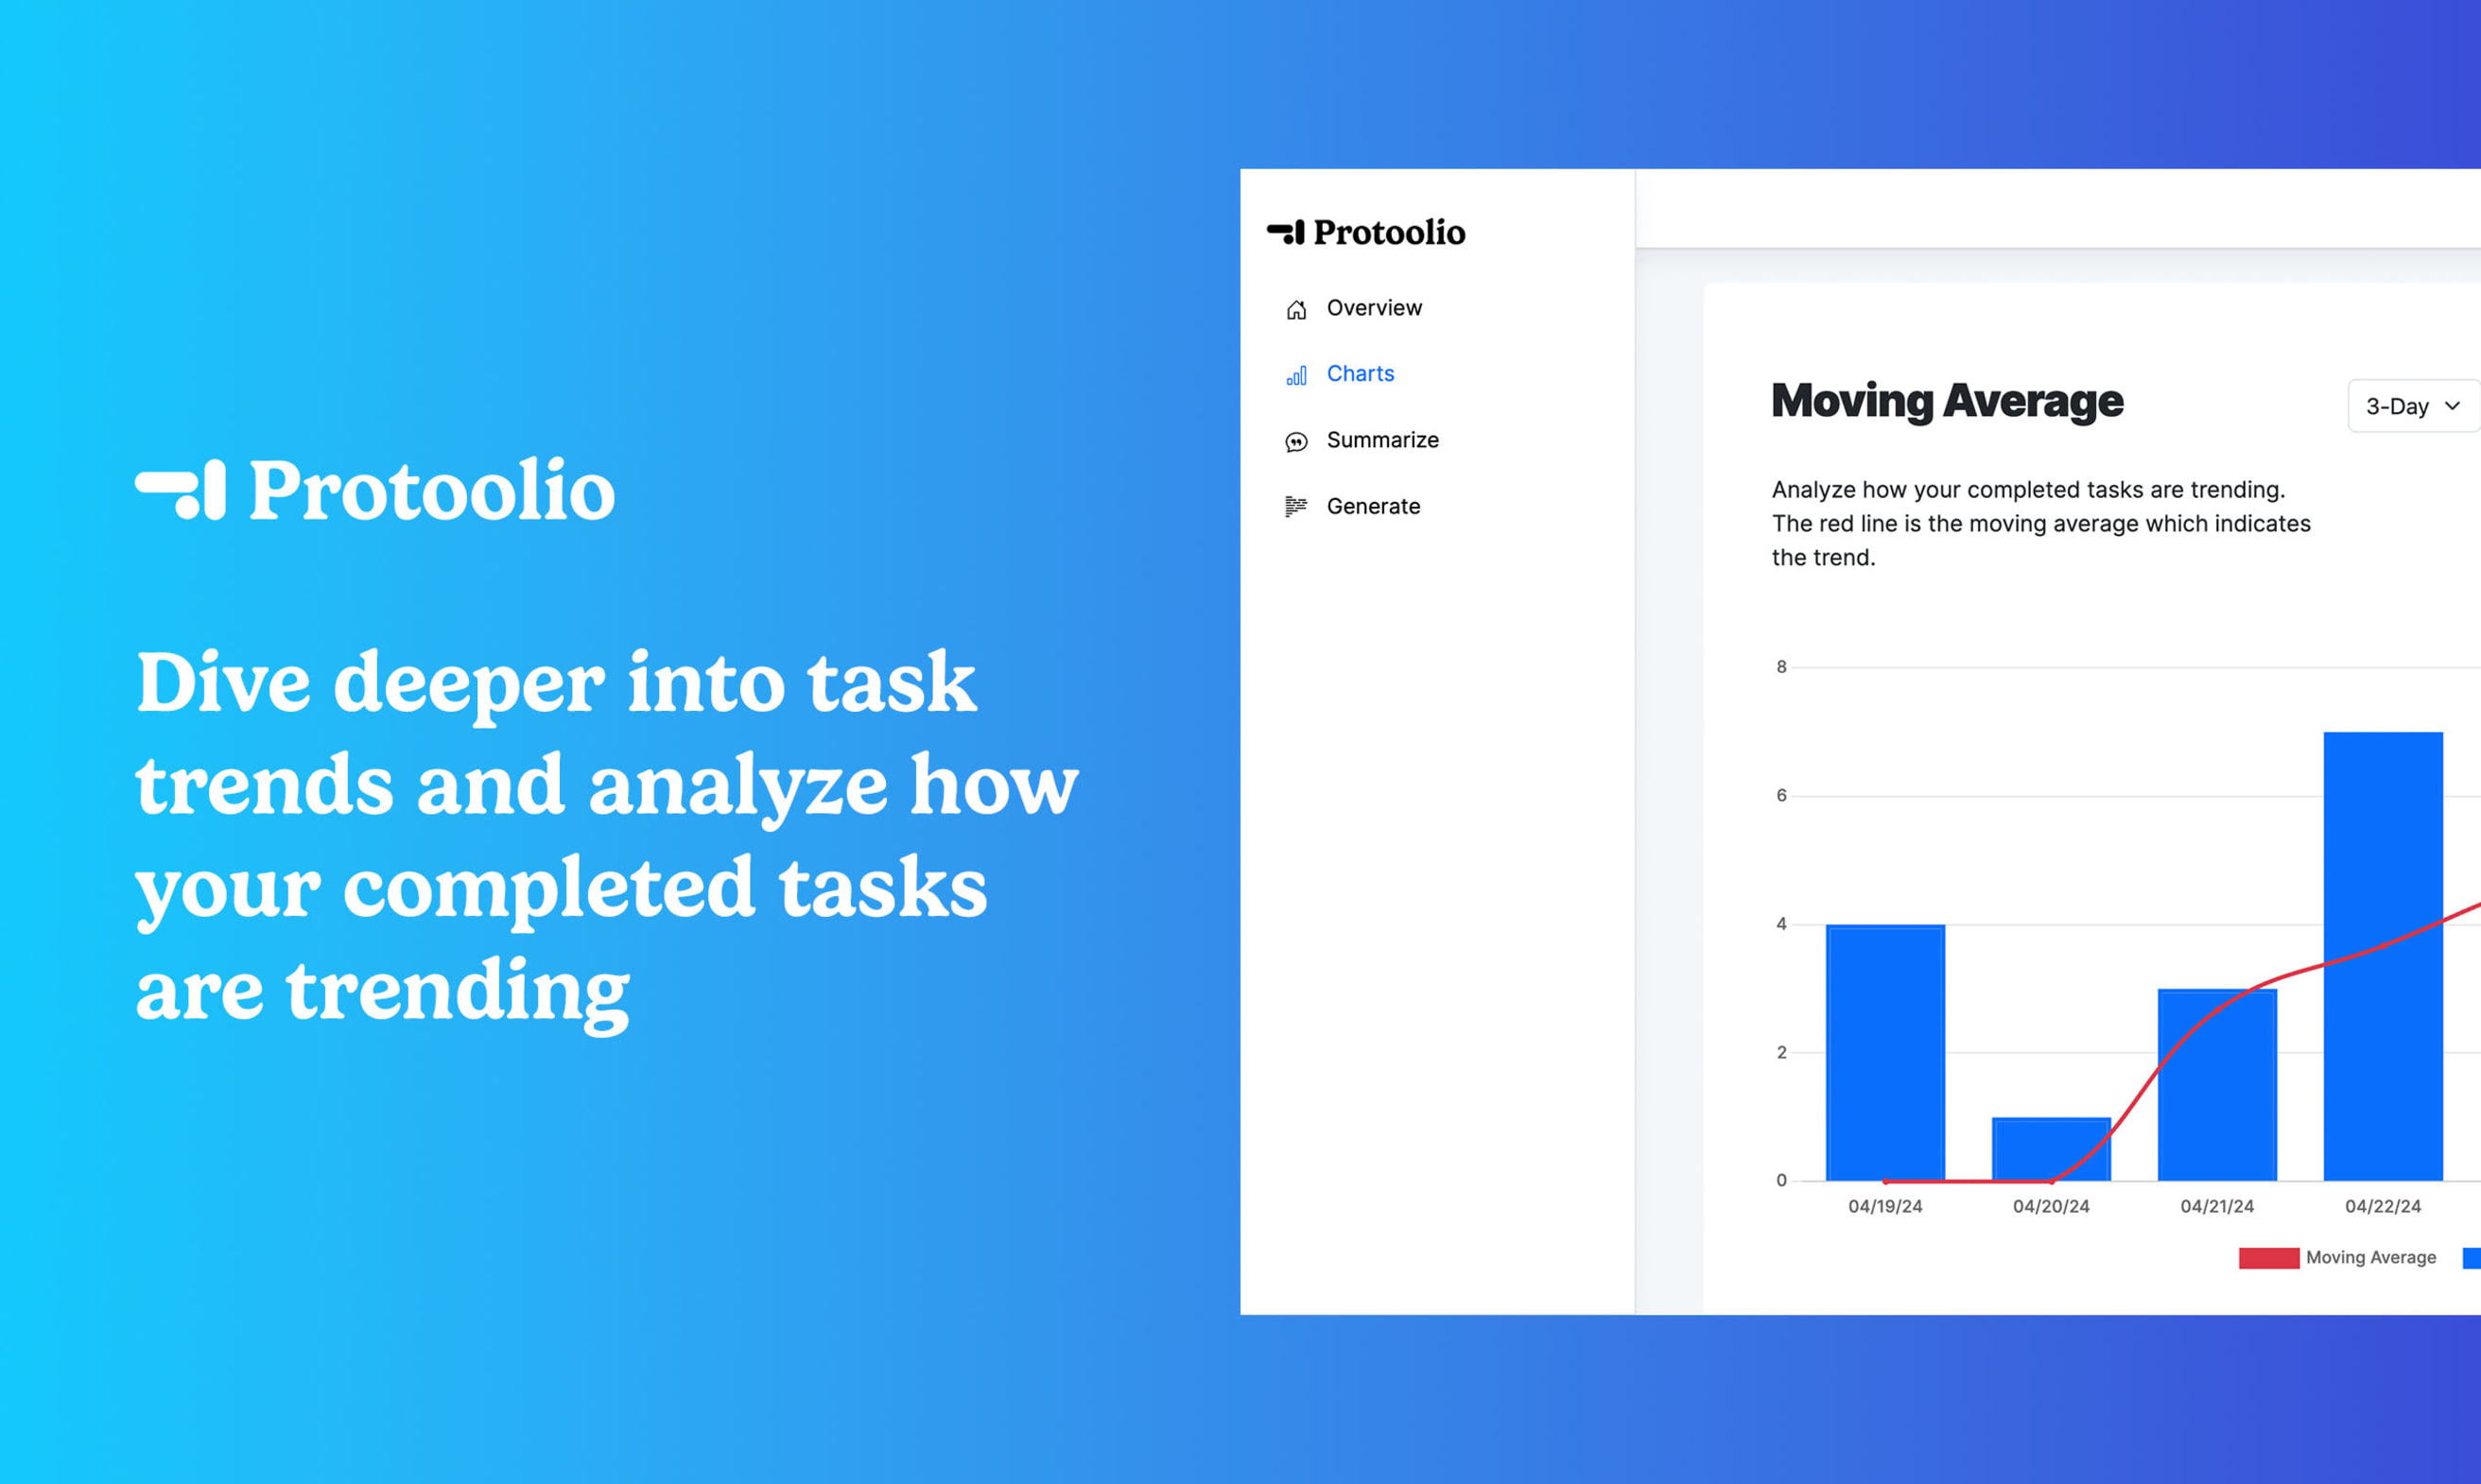
Check completed tasks, completion rate, daily averages, top projects, and more. Explore detailed charts like heatmaps, moving averages, and project-specific time series. Discover your peak productivity times by analyzing common task completion hours and days.

Funksjoner

  • See metrics like completed tasks, completion rate, daily task average, most active project, and more.

  • See your completed tasks over a period of time. You can arrange the chart by days, weeks, or months.

  • Get a breakdown of your projects and task priorities.

  • Dive deeper into task trends and analyze how your completed tasks are trending with a 3-day and 7-day moving average.

  • See when you are most productive by analyzing the most common hours of the day and days of the week you complete tasks.

Todoist Pro gir deg kraften til å få alt gjort

Husk alt med påminnelser, følg med på så mange prosjekter som du måtte trenge, få alt til å se bra ut med Pro-temaer, og mye mer.

Oppgrader nå